Curriculum links | Rubric | Student Sample
Investigation: Brief description of action
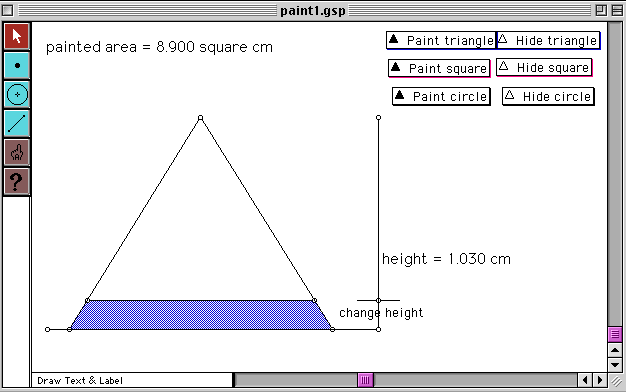
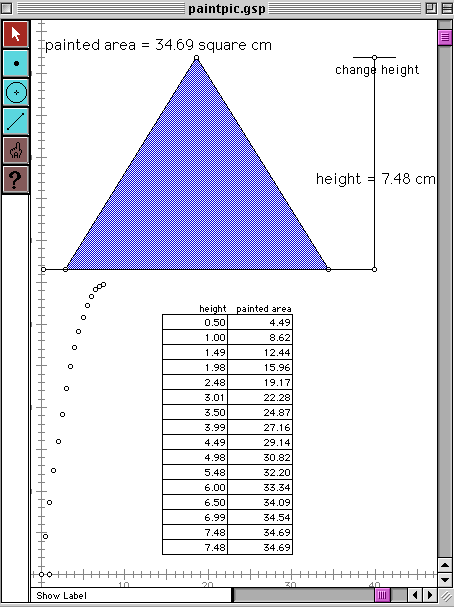
- 1. Paint triangle, from bottom up, in 1, 2, 5 (or some other suitable) units of area,
keeping track of the height reached by painting by using a table.
Download GSP sketch (for PC or Mac).

- When finished [or as (area, height) pairs are generated] plot the table data on a graph.
Connect characteristics of graph with painting the triangle (in words).
- Predict what the graph would have looked like if the triangle had been narrower. Verify
using GSP to paint a new triangle and graphing the area, height result.
- How do you think that the graph would have changed if you had plotted the area remaining
to be painted at each height? Explain your reasoning. Verify with GSP.
- Predict the shape of a graph if you painted a rectangle. Explain the reasoning you used to
make your prediction. Use GSP to verify your prediction. Explain any surprises.
- Suppose you turned the rectangle on its side. and then painted it. Describe the change you
would predict in the graph. Use GSP to check your prediction.
- Investigate other shapes of your (or teacher) devising, predict outcomes, verify, report.
Overall Expectation (Gr 9 Academic/Applied)
Curriculum links: Investigating Geometric Relationships, Grade
9
- determine the properties of angle bisectors, medians, and altitudes in various types of
triangles through investigation;
- formulate conjectures and generalizations about geometric relationships involving
two-dimensional figures, through investigations facilitated by dynamic geometry software,
where appropriate.
Curriculum links: Relationships, Grade 9
- pose problems, identify variables, and formulate hypotheses associated with relationships
- demonstrate an understanding of some principles of sampling and surveying (e.g.,
randomization, representivity, the use of multiple trials) and apply the principles in
designing and carrying out experiments to investigate the relationships between variables
- collect data, using appropriate equipment and/or technology (e.g., measuring tools,
graphing calculators, scientific probes, the Internet)
- organize and analyse data, using appropriate techniques (e.g., making tables and graphs,
calculating measures of central tendency) and technology
- describe trends and relationships observed in data, make inferences from data, compare the
inferences with hypotheses about the data, and explain the differences between the inferences
and the hypotheses
- communicate the findings of an experiment clearly and concisely, using appropriate
mathematical forms (e.g., written explanations, formulas, charts, tables, graphs), and justify
the conclusions reached;
- solve and/or pose problems related to an experiment, using the findings of the experiment.
- construct tables of values, graphs, and formulas to represent linear relations derived
from descriptions of realistic situations
-
construct tables of values and graphs to represent non-linear relations derived from
descriptions of realistic situations
- construct tables of values and graphs to represent non-linear relations derived from
descriptions of realistic situations
Assessment of Performance
In preparation
Level 4
Level 3
Level 2
Level 1
Sample Student Response
Level 3 (Investigation #2)
Download PC GSP file | Download Mac GSP file

| |


